Expert Talk: Implications of Fluctuating Carbon Prices to Industrial Decarbonization
Industry at Risk of Falling Behind
By Alexander Hoogsteyn & Flore Verbist
Putting a price on carbon dioxide emissions is a complex task, managed by the European Union Emission Trading Scheme (EU ETS), which responds to market dynamics. However, in recent years, this system has faced challenges due to volatile prices, fluctuating between 100 EUR per ton of CO2 equivalent (tCO2e) to less than 55 EUR/tCO2e. Such instability raises concerns as it may deter investments in emission reduction efforts. In this article, we delve into how these fluctuations affect industries and explore the intricacies of emission trading amid uncertainty stemming from government policies. Understanding these complexities is vital as they not only impact industries but also hinder progress towards achieving climate targets.
European Carbon Pricing: How Does it Work?
In industry, the production of materials and components leads to greenhouse gas emissions (GHG), primarily carbon dioxide. However, by 2050, an economy-wide net-zero emission target is mandated to avoid any further climate warming and associated damages. The “polluters pay principle” aims to achieve this by assigning a cost to each ton of CO2 emitted, making polluters accountable for their environmental impact. This principle incentivizes investments in green technology – with minimal emissions – making them more economically attractive than conventional, polluting methods.
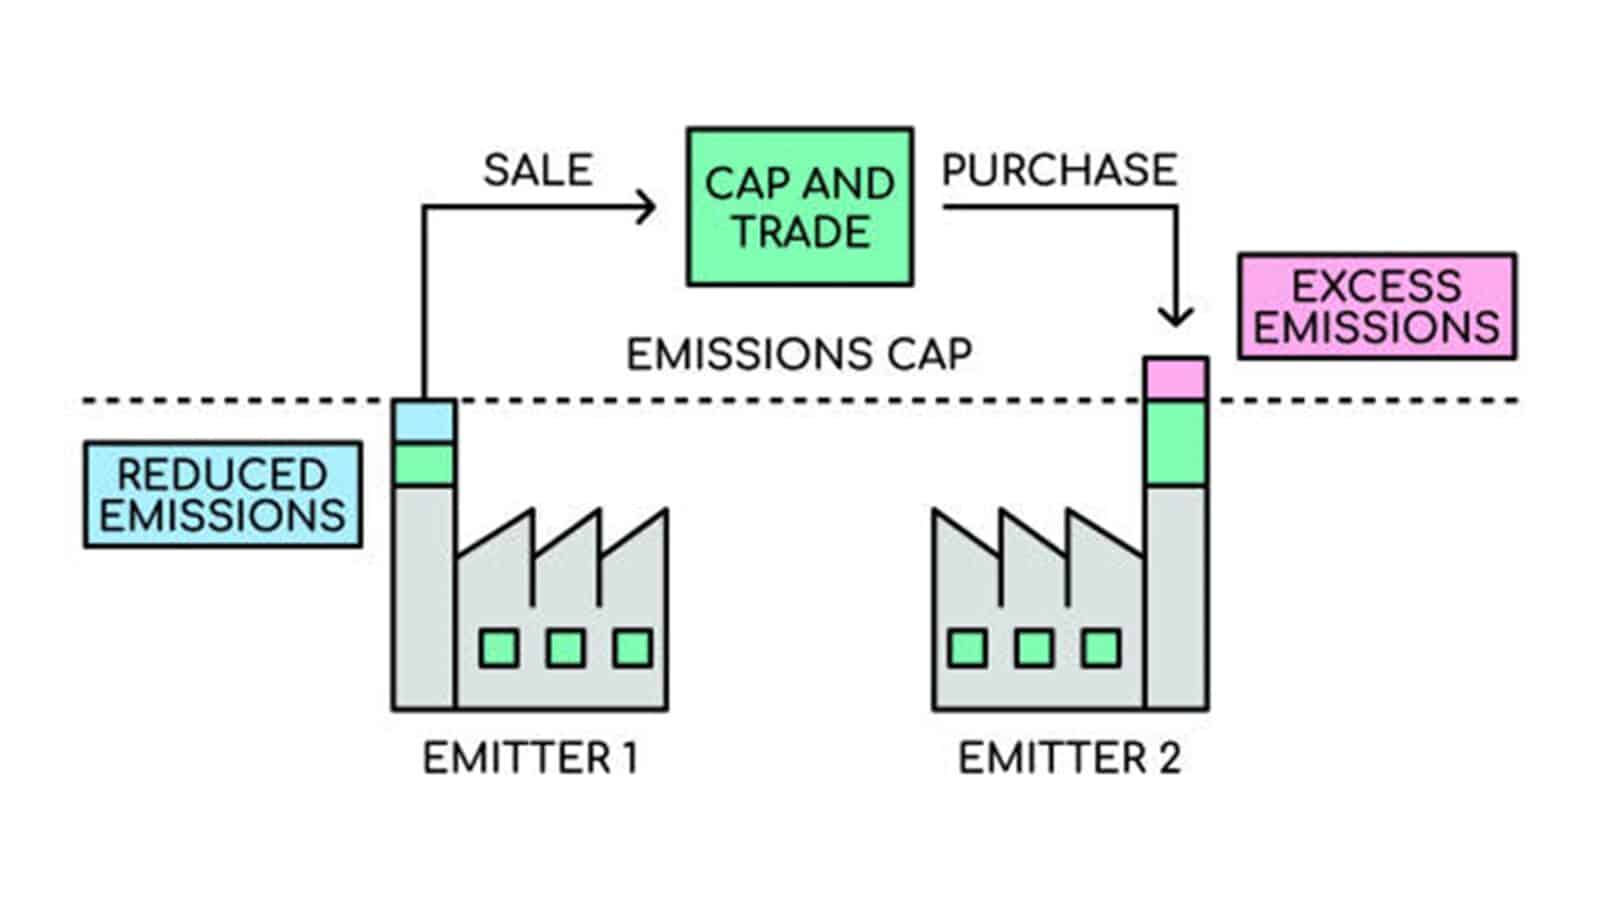
Since 2005, The European Union has been implementing this “polluters pay principle” through the European Union’s Emission Trading Scheme (EU ETS) to regulate large industrial emissions. Operating as a market-based “cap-and-trade” system, the EU ETS sets a sector-wide limit on the maximum number of emission allowances supplied each year. These allowances grant the holder the right to emit one ton of CO2 equivalent into the atmosphere.
The pricing of these allowances is decided through auctions or trading, among market participants seeking to buy or sell emission rights. At the close of each year, companies must surrender allowances equal to their emissions of that year. Unused allowances remain valid for future use or can be traded with other emitters, fostering in this way a dynamic market.
As the supply of allowances diminishes each year, the right to emit becomes increasingly scarce. This mechanism aims to incentivize investments in green technologies across sectors within the EU ETS. Notably, this not only includes large industrial emitters, but also the power sector, air travel (within the EU, Norway, Iceland, and Liechtenstein), and maritime transport.1 Together, these sectors account for approximately 40% of the EU’s emissions, involving around 11,000 European companies [1,2].2
Such a cap-and-trade system offers two key advantages over alternative carbon pricing mechanisms, such as direct carbon taxes or sector-based emission standards. Firstly, unlike a carbon tax, the cap sets a limit on the total amount of emissions allowed. This ensures that GHG emissions remain within a predefined carbon ‘budget’, preventing overshoot. Secondly, in contrast to emission standards, the system establishes a market where trading can occur, fostering the most cost-effective emission reductions over time and across sectors. Under this system, investment in the cheapest technologies will occur first, allocating the allowances to firms with more costly emission reductions (as illustrated in Figure 1).
1 – Maritime transport in between ports in EU ETS covered regions is fully covered. Voyages that either start or end in an EU ETS covered region, 50% of emissions are covered.
2 – The other 60% of emissions related to buildings, transport, agriculture, small industries, and waste incineration, is currently regulated on a member state level, each applying their own instruments to obtain the projected climate targets.
Industry’s Challenge: Unstable Investment Climate
Historical Trends of Low ETS Prices
But allowing market forces to dictate emissions prices has its drawbacks. Factors such as economic recessions and the structure of the market have resulted in persistently low prices, often below 25 EUR/ tCO2e until 2018. This was attributed to a lack of ambitious long-term climate targets and the right to purchase international credits, leading to an oversupply of emission rights.
In general, low ETS prices fail to provide a strong incentive to decarbonize [3]. To illustrate the impact on industrial investment in low-carbon technologies, consider a company contemplating investment in carbon capture and storage (CCS) technology to mitigate emissions from its cement production. While CCS reduces emissions, it also raises production costs. For instance, let’s say this translated to an added cost of 150 EUR/tCO2 [4]. Hence, the company needs assurance that future ETS prices will surpass this threshold to make CCS investment financially viable compared to conventional carbon-intensive production methods.
Recognizing this need for higher prices to incentivize investment in innovative low-carbon technologies, adjustments have been made to the ETS since 2018.
Firstly, the introduction of the “Market Stability Reserve” in 2019 aimed to address the surplus of allowances by reducing the auctioned volume, thereby boosting prices. This occurs when the number of unused allowances exceeds a specified threshold [5]. The reserve can also bring the allowance back into the market when there are not enough allowances circulating in the market, or it can invalidate those allowances whenever the reserve overflows3 [6].
Secondly, the Fit for 55 package implemented in 2021 sets more ambitious emission reduction targets for 2030, requiring a collective net reduction of 62% compared to 2005 levels for ETS-covered sectors4. These measures signal a concerted effort to bolster ETS prices and stimulate investment in emissions reduction technologies within the industrial sector.
3 – As of 2023, if more than 833 million allowances are in circulation (i.e. unused) in a given year, 12% of the auction volume of the next year is put in the reserve which has a maximum allowed capacity of 400 million allowances. All excess allowances allocated to the reserve get destroyed, meaning that the carbon budget also decreases.
4 – Note that the overall emission reduction target in 2030 is 55%, compared to 1990 levels. Overall, the ETS-related target is more ambitious than the reduction target related to non-ETS sectors. For the latter, each member state has a separate target that needs to be met.
Navigating Volatility in EU ETS Prices
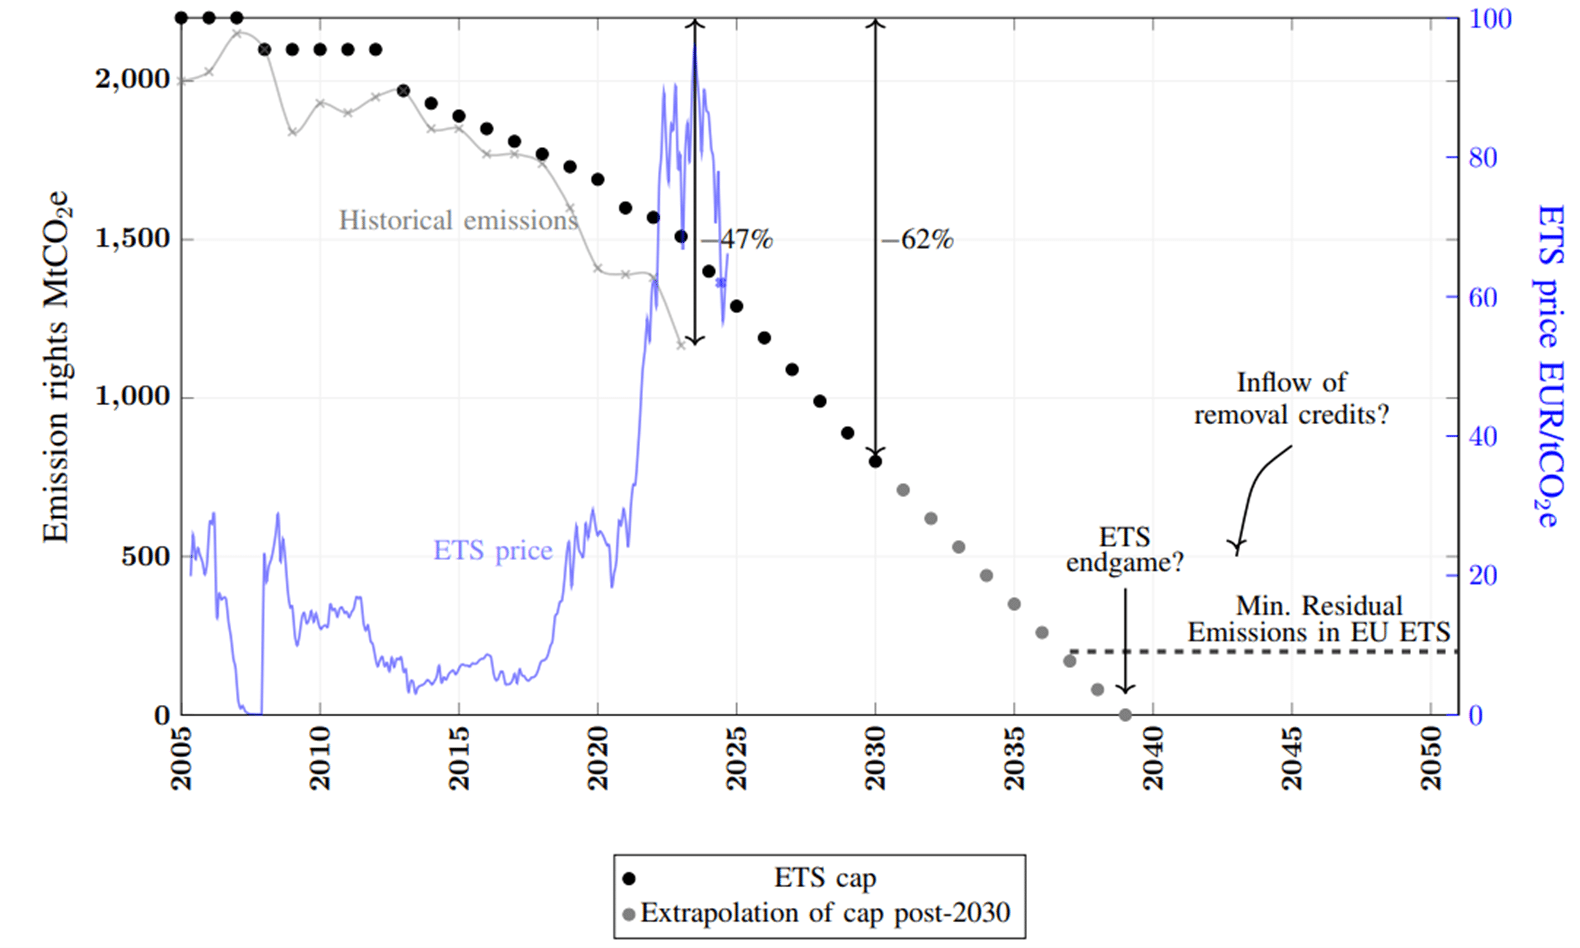
While current emissions have shown a promising decline of 47% compared to 2005 levels (as shown in Figure 3), much of this progress stems from picking low-hanging fruits, such as boosting renewable energy in the power sector [7]. However, the challenge becomes more pronounced in sectors like industry and aviation, where emission reduction is inherently more complex. A key obstacle in these endeavors? The volatile nature of EU ETS prices.
In recent years, we’ve seen significant fluctuations in ETS prices, with peaks hitting 100 EUR/tCO2e in 2023, only to plummet back to 55 EUR/tCO2e. What drives this volatility? A combination of short-term factors, including lower-than-expected gas prices, temporary surges in auction volumes, reduced industrial activity, and decreased demand for hedging in the power sector5. This instability makes it difficult for industries to develop long-term strategies to decarbonize [3].
The repercussions of this volatility are substantial. Even if ETS prices theoretically have the potential to incentivize companies to invest in sustainable technologies (with the long-term ETS price expected to rise due to a decreasing cap), the uncertainty surrounding these prices makes such investments appear risky. Consequently, this hampers our progress in meeting the emission reduction targets outlined in the Fit for 55 package by 2030.
5 – The hedging demand relates to allowances bought by firms on top of the immediate need for allowances to ‘hedge’ or protect themselves from potential higher future carbon prices. This happens primarily by power firms as they often sell power several years in advance. As a coal phase-out takes place, those hedging demands decline due to a reduced need to emission rights.
Towards Sky-High EU ETS Prices?
The uncertainty surrounding investments stems not only from the instability of ETS prices but also from the absence of a long-term vision for the EU ETS design. Currently, the ETS and its related supply volumes, dictated by the cap, are outlined only until the year 2030. However, what lies beyond this horizon remains unclear. Extrapolating the current cap trajectory (as seen in Figure 3), suggests that the ETS could reach its endgame by 2039, where the supply of allowances dwindles to zero. This scenario, coupled with delayed emission reductions, particularly evident in sectors like industry and aviation, could propel ETS prices to unprecedented heights.
Even with aggressive efforts to reduce emissions, certain sectors will inevitably have residual emissions that cannot be fully mitigated through technology advancements alone. Take, for example, process emissions in the cement industry, which cannot be eliminated even with carbon capture technology [8]. Without sufficient emission allowances, these industries face the looming threat of closure. This uncertainty surrounding future emissions casts doubt on the viability of investments today, further worsening the prevailing investment climate.
To address these challenges, consideration must be given to implementing negative emission technologies, also known as removal technologies6. Next to nature-based approaches such as afforestration, these technologies could help offset remaining emissions, thereby adhering to carbon budgets and potentially stabilizing carbon prices at acceptable levels.
6 – There are two main negative emission technologies. Those are bio-energy- (BECCS) and direct air carbon capture and storage (DACCS), where we capture CO2 after utilizing biomass for energy purposes or directly from the air. Both approaches remove atmospheric CO2 directly in the case of DACCS and indirectly in the case of BECCS.
How to Address this Uncertainty? Research @EnergyVille
In this article, we addressed two crucial issues surrounding carbon pricing today: (1) price volatility and (2) the lack of insight into future carbon pricing. At EnergyVille, researchers are investigating potential solutions to tackle these challenges.
Subsidy Policies to Combat Price Volatility?
As discussed, carbon prices often fall short in providing a clear and stable price signal to industries, hindering deep decarbonization efforts. At EnergyVille, we are examining policies that could complement carbon pricing to create a more stable investment climate.
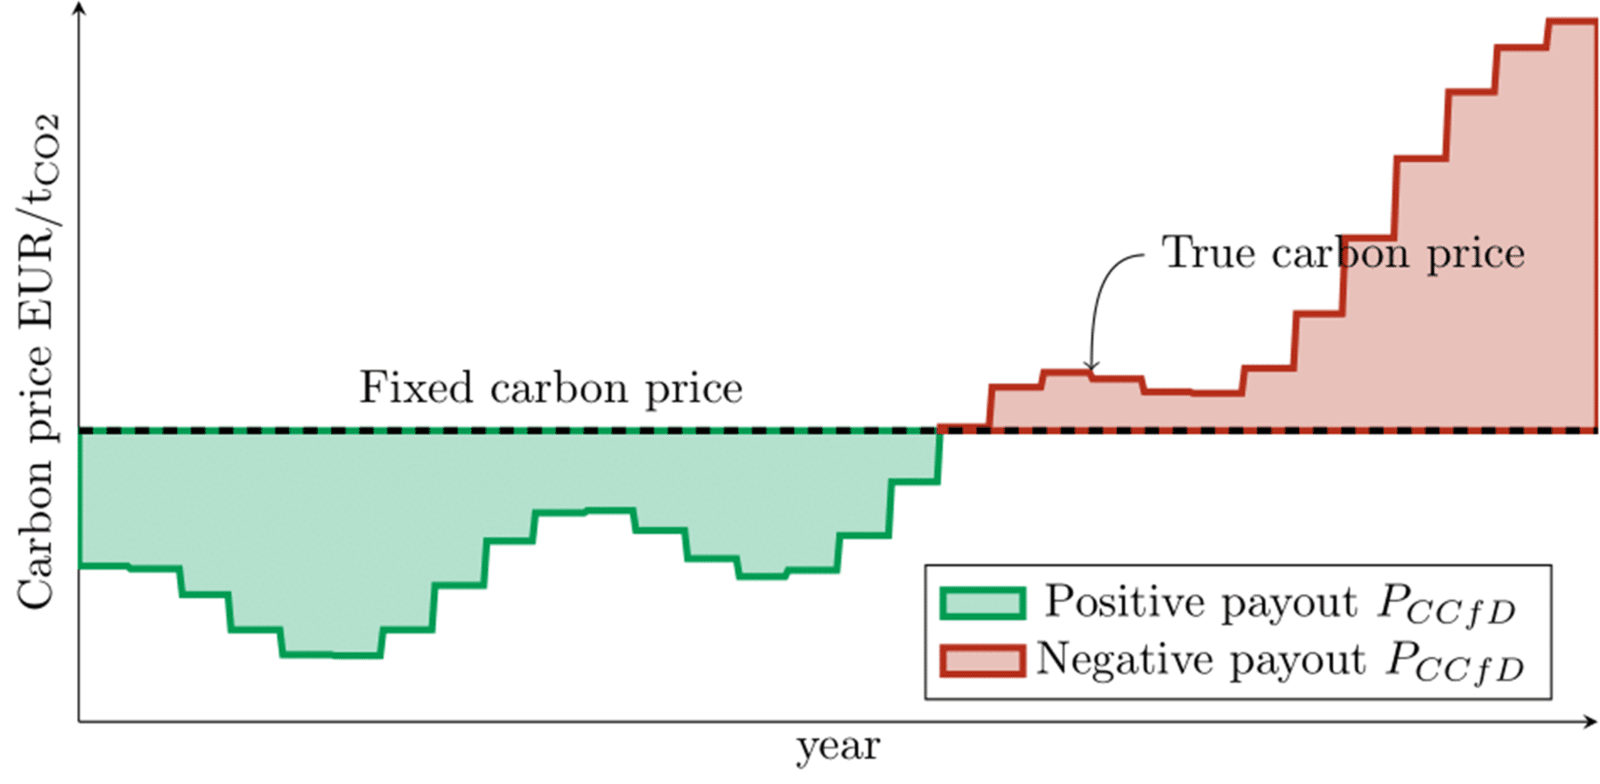
One such solution is the implementation of a Carbon Contract for Difference (CCfD) [8]. This approach ensures that investors transitioning to carbon-neutral technologies receive stable compensation, shielding them from the fluctuating ETS prices. CCfD could be applied to various sectors, such as carbon-free steel production, green ammonia production using hydrogen, or carbon capture solutions.
A key feature of this policy is its linkage to carbon prices: the lower the carbon price, the higher the compensation. This mechanism aims to offset fluctuating carbon prices, ensuring investors receive an agreed-upon price. (For instance, 150 EUR/tCO2 in the case of the cement firm we discussed earlier.) However, once ETS prices surpass the agreed level, there is a reverse payment from industry to the government, preventing overcompensation and limiting societal costs (detailed in Figure 2).
While the CCfD concept has gained traction for its risk reduction function among academics, its success is rather attributed to its subsidy function. Its efficacy in reducing uncertainty remains a subject of debate, detailed in our comprehensive paper on the topic [10].
Removals to Hedge Against High ETS Prices?
In contrast to measures addressing price volatility, more radical changes to the ETS are imperative to prevent sky-high prices beyond 2030. This necessitates deploying carbon removals for remaining emissions and achieving net-negative emissions post-2050. To incentivize removal adoption, a “removal rewards principle” akin to the polluter pays principle should be set up. However, a well-regulated removal framework does not exist yet in Europe as removals pose challenges, including the risk of undermining emission reduction efforts and the occurrence of greenwashing. The optimal integration of removal pricing with emission pricing is currently under scrutiny and in a consultation phase. With research within EnergyVille on optimal policies in relation to carbon removals, we hope to contribute to the policy discussion currently taking place in the EU.
Key-points
- The EU ETS partially fails to provide a stable price signal, impeding industrial decarbonization efforts and endangering climate goals.
- Carbon Contracts for Differences (CCfDs) offer a potential solution to shield industries from volatile carbon prices, fostering investments in green technology.
- In the long term, hard-to-abate industries anticipate sky-high carbon prices and the risk of ceasing operations in Europe, as the EU ETS lacks provisions to manage residual emissions. More transformative changes, such as integrating carbon removals, are imperative.
- Any regulatory adjustments to the ETS should be approached cautiously, as they may introduce additional uncertainties into the system.
About the Authors

Flore Verbist received an MSc in Sustainable Energy Technology from TU Delft (The Netherlands) in 2022. In 2023, she was awarded the Young Energy Leader Award by Eneco. She is currently pursuing a PhD in Mechanical Engineering at KU Leuven in collaboration with VITO/EnergyVille. Her research focuses on the economic and system integration aspects of carbon capture, utilization and storage.

Alexander Hoogsteyn is a Master’s graduate in Electrical Engineering pursuing a Ph.D. at ESIM, KU Leuven/EnergyVille, since 2022. Alexander’s research centers on utilizing optimization techniques to explore economic policies related to industrial decarbonization and the role of hydrogen (and its derivatives) in a climate-neutral society. These economic policies encompass carbon pricing mechanisms, hydrogen subsidies, and risk-mitigation instruments such as contracts for difference.
References
[1] Rob Heirbaut, “Brengen extra gascentrales de Europese klimaatdoelstellingen in gevaar?,” Nov. 13, 2021. [Online, Accessed Apr. 5, 2024] Available: https://www.vrt.be/vrtnws/nl/2021/11/08/brengen-extra-gascentrales-de-europese-klimaatdoelstellingen-in/
[2] Alexander Hoogsteyn, “How does emission trading work?”, 2024. [Online, Accessed Apr. 5, 2024] Available: https://renewablereads.com/2024/04/02/how-does-emission-trading-work/
[3] Delarue, Erik, Kris Voorspools, and William D’haeseleer. 2008. “Fuel Switching in the Electricity Sector under the EU ETS: Review and Prospective.” Journal of Energy Engineering 134 (2): 40–46. https://doi.org/10.1061/(ASCE)0733-9402(2008)134:2(40).
[4] European Commission, Joint Research Centre, Marmier, A. (2023). Decarbonisation options for the cement industry, Publications Office of the European Union. https://data.europa.eu/doi/10.2760/174037
[5] A. Schopp, W. W. Acworth, D. Huppmann, and K. Neuhoff, “Modelling a Market Stability Reserve in Carbon Markets,” SSRN Journal, 2015, doi: 10.2139/ssrn.2616333.
[6] Bruninx, K., & Ovaere, M. (2022). COVID-19, Green Deal and recovery plan permanently change emissions and prices in EU ETS Phase IV. Nature Communications, 13(1), Article 1. https://doi.org/10.1038/s41467-022-28398-2
[7] European Commission, “Record reduction of 2023 ETS emissions due largely to boost in renewable energy – European Commission,” Climate Action. Accessed: May 02, 2024. [Online]. Available: https://climate.ec.europa.eu/news-your-voice/news/record-reduction-2023-ets-emissions-due-largely-boost-renewable-energy-2024-04-03_en
[8] European Environment Agency (EU body or agency) and European Scientific Advisory Board on Climate Change, Scientific advice for the determination of an EU-wide 2040 climate target and a greenhouse gas budget for 2030–2050. Publications Office of the European Union, 2023. Accessed: Apr. 03, 2024. [Online]. Available: https://data.europa.eu/doi/10.2800/609405
[9] Richstein, J. C., Neuhoff, K. 2022. “Carbon Contracts-for-Difference: How to de-risk innovative investments for a low-carbon industry.” iScience, 25(8): 104700. https://doi.org/10.1016/j.isci.2022.104700
[10] Hoogsteyn, A., Bruninx, K., & Delarue, E. (2023). Carbon Contracts for Difference Design: Implications for Energy Markets and Carbon Pricing Mechanisms. http://dx.doi.org/10.2139/ssrn.4661138
[11] European Environmental Agency, “Total net greenhouse gas emission trends and projections in Europe.” Accessed: Apr. 11, 2024. [Online, Accessed Apr. 5, 2024]. Available: https://www.eea.europa.eu/en/analysis/indicators/total-greenhouse-gas-emission-trends