Expert Talk: High penetration of wind and sun possible with minimal costs for grid reinforcement
With large amounts of wind and solar energy in our electricity system, the variation in electricity production from wind and solar generators can cause problems for the electricity grid. This expert talks explains how the share of renewable energy in the Belgian Electricity grid can be further extended, without affecting the electricity grid.
Written by dr. Marc Meuris, Pieter Lodewijks en prof. dr. ir. Jef Poortmans. Marc Meuris is programme manager of the research group ‘Alternative Thin Film PV’ within imec/EnergyVille. Pieter Lodewijks is programme manager at VITO/EnergyVille of the research group ‘Smart Energy & Built Environment’. Together they are responsible for the research project Bregilab in which it is investigated how the share of renewable energy in the Belgian electricity grid can be further extended.
With large amounts of wind and solar energy in our electricity system, the variation in electricity production from wind and solar generators can cause problems for the electricity grid. On a sunny summer day PV panels produce very large amounts of electricity at noon. If we install massive quantities of solar panels, this can lead to overcapacity at noon, especially on the low-voltage grid. In that case the voltage of the grid will rise too high locally. In the worst case the injection on the grid of the panels must be switched off so that the voltage does not exceed the permissible limit. But at what quantities exactly does this problem become acute? And are there simple and inexpensive solutions to limit this problem?
Recently, EnergyVille published a study [1] in which this problem was calculated for the Belgian electricity grid. In this study a proposal was made to use large amounts of wind and solar energy in the Belgian electricity grid and to keep the aforementioned problems for this network within bounds. The local overcapacity of the low-voltage grid was not studied in this study, but will be part of a new research project Bregilab.
Towards an optimal balance for wind and solar energy in the energy mix
In the study, wind energy is based on an average and realistic location of wind production [2,3,4,5]. Offshore wind was calculated with a capacity of up to 4GW (this corresponds to approximately 800 to 1000 windmills). Currently 2.3 GW of windmills has already been planned, the remaining quantity is the result of a recent political decision. For the first part the connection capacity to the high-voltage grid was developed, for the second part, the impact on the electricity grid is still being studied. For windmills on land, the study assumes 5 GW of capacity. This is just over half of the potential in Belgium. Offshore wind is distributed on the high-voltage grid and the wind turbines on the land are connected to a lower voltage level.
The study also examines how much PV capacity can be added to meet the total electricity demand, taking into account the potentially high peak production of PV. For the installation of PV panels, a distinction was made between the residential panels, which are placed on individual houses and connected to the low-voltage grid, and the PV production sites of electricity suppliers that are placed on a higher voltage level. For the residential panels, the injection of the solar panels on the grid was limited, so that no more than 6 GW in globo is injected via the low-voltage grid onto the Belgian grid. This 6 GW limit amounts to 1.5 kW per connection point in Belgium. This is less than the 30% simultaneity of the total connection power on the low-voltage grid. This latter criterion is often used in the design of the low-voltage network, assuming that the percentage of the total connection power of the connection points in use can never be over 30%. For the commercial panels, the same injection limit was used as for the residential ones.
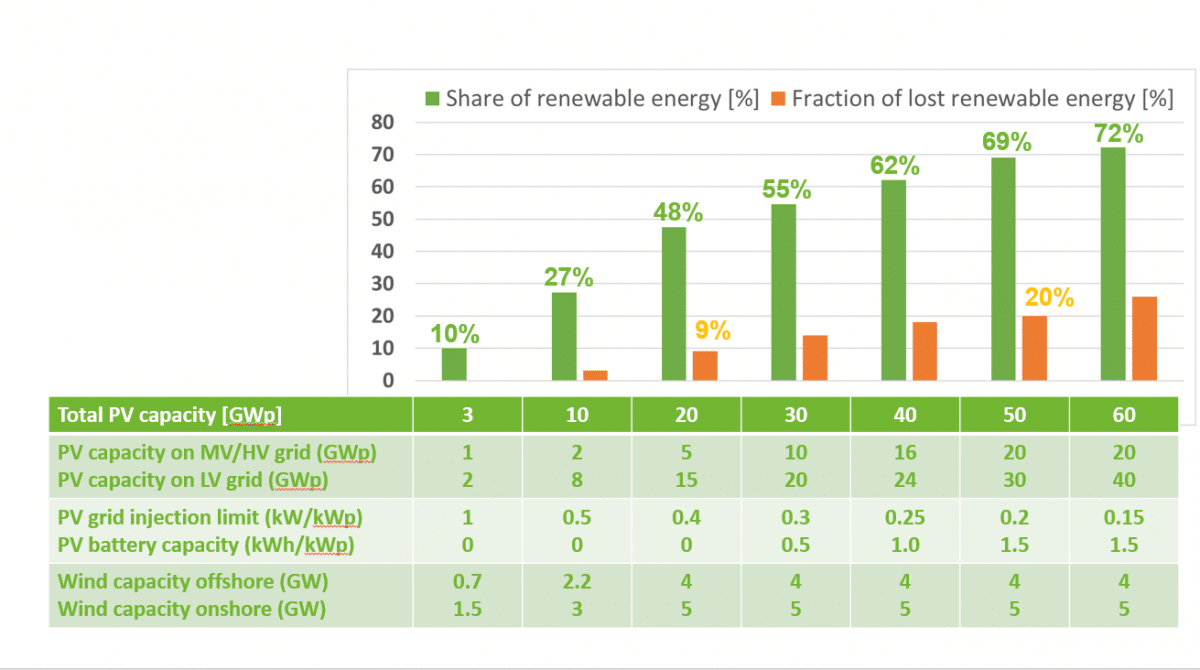
The results of the study are shown in the figure above. 20 GWp solar panels (15 GWp on low-voltage grid and 5 GWp on a higher voltage grid) combined with the 9 GW wind capacity results in almost 50% of the total electricity consumption in Belgium to be renewable. With this amount of PV and wind, no batteries are needed to reach the 50%. The injection limit of 0.4 kW per kWp installed PV panels ensures that the low-voltage grid is protected against overvoltage. We only foresee some sporadic grid reinforcements with minimum investment costs will be required. The only drawback of this solution of the PV injection limit is that with this 20 GWp PV capacity about 10% of the PV production has to be curtailed. But it is being examined whether this 10% can be used for, for example, domestic hot water production in the houses where PV panels are installed. In any case, the maximum additional cost of an injection limit amounts to 10% of the PV cost. Taking into account that no other large costs are necessary, this would be an inexpensive way to produce 50% of the Belgian electricity with PV and wind.
The role of extra battery capacity
In a second phase, the amount of PV panels can be further increased. In the study, up to 60 GWp of solar energy was simulated. In this case, lower injection limits are required to protect the low-voltage grid. The more residential PV panels are installed, the lower the injection limit should be to keep the total sum of the injection on the low-voltage grid at 6 GW. But these lower injection limits also mean less and less of the generated energy from the PV panels can be placed on the grid. The loss of PV production then quickly rises to more than 30%. To counter this problem, batteries can be placed together with the PV installations. By placing even a relatively small battery capacity with the PV panels, the loss of PV production can be reduced between 10 and 20%. This can be seen in the figure when deploying resp. 30, 40, 50 and 60 GWp of total PV production. The study opted for an optimal balance between injection limit to protect the low-voltage grid and the placement of battery capacity. For each additional 10 GWp of solar panels, 0.5 kWh / kWp of battery capacity is provided. This emerged from the study [1] as an optimal combination. In the study, the battery was recharged during the day when the PV production exceeded the injection limit and completely discharged into the grid each night, so that it could start a new cycle the next day.
From 20 GWp onwards, when installing an additional 10 GWp of PV panels, combined with 0.5 kWh / kWp of batteries, it is possible to use about 7% more renewable electricity each time. With a total combination of 9 GW wind, 50 GWp PV and 1.5 kWh / kWp batteries, 70% of the electricity consumption in Belgium can be supplied with renewable energy. This without having to invest heavily in grid reinforcement. Above 50 GWp it becomes more difficult and a further increase to 60GWp PV leads to an extra use of renewable energy of only 3% (instead of 7%). Interestingly, extra battery capacity at 60 GWp no longer helps; the amount of renewable energy that can be used does not increase when batteries are used. This is because all the batteries in the study were discharged at the same time during the night and with those large quantities the electricity that is discharged via the battery on the net regularly competes with wind production, which ultimately leads to an overproduction of renewable energy compared to the consumption.
Practical feasibility
For those who are skeptical of this high capacity of wind and PV, there are a few facts that show this implementation does not have to be fiction. The placement of windmills at sea and land has already been considered in a number of plans and found realistic [2,3,4,5]. For PV, there is a total available potential of 70 GWp on roofs in Flanders [6]. For the whole of Belgium we can extrapolate that to a potential of 100 GWp exist on roofs alone. If we would install PV on only half of the roofs in Belgium, we already reach the 50 GWp proposed in the second phase.
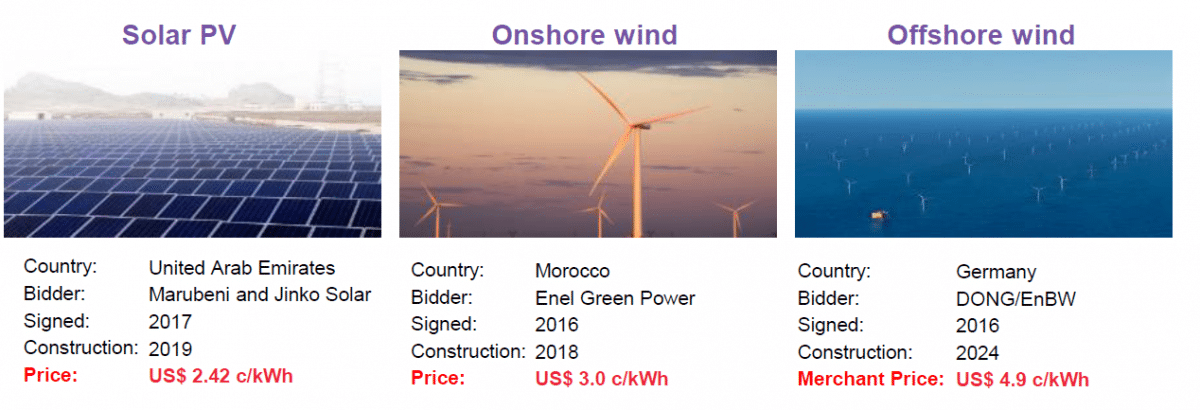
As far as cost price is concerned: in the United Arab Emirates they approved a solar energy project in 2017 that will supply electricity at 2.99 c $ / kWh [7] and in Morocco an onshore wind project has been approved that will generate electricity at 3 cS / kWh [7]. With the current exchange rate, this translates to 2.6 cEUR / kWh. The yield of this type of installation should be estimated two times lower in Belgium due to less availability of sun. Similar auctions can therefore yield prices in the order of 5 to 6 c / kWh. This is comparable with the current price of electricity in Belgium.
Bregilab project
In the transition fund of the FPS Economy, the project Bregilab [8] got approved earlier this year. The project will elaborate these findings more quantitatively and in detail. Improved control algorithms for both injection limits and battery control are being studied. The influence of the installation of windmills and solar panels on the Belgian territory will be examined in function of the grid load so that costs for grid reinforcement can be minimized. The influence of future consumer profiles, such as electric cars and heat pumps, is also included in the calculations.
Conclusion
Wind and PV will be an important component in the electricity mix. In a first phase, the extension of wind and solar energy can enable to generate 50% of the total electricity demand in a cost efficient way.
References
[1] M. Meuris et Al., Prog Photovolt Res Appl. 2018;1–13., DOI: 10.1002/pip.3084
[2] Federaal planbureau (http://www.plan.be). Report on: Het Belgische energiesysteem in 2050: Waar naartoe? – Beschrijving van een Referentiescenario voor België (Oct 2014). (Dutch and French version)
http://www.plan.be/publications/publication-1388-en-het+belgische+energ… (2014) [accessed 20 dec 2017].
[3] Esch, L.V., Meynaerts, E., Vermeiren, K., Uljee, I., Janssen, L., Guisson, R., Engelen, G., Robeyn, H.H.e.N. “Hernieuwbare EnergieAtlas Vlaamse gemeenten”, VITO, TerraEnergy, Belgium (2016).
[4] Infrax, Eandis, Elia. “Onthaalcapaciteit decentrale productie in Vlaanderen 2011-2020”, Studie, Belgium, p. 133 (2012).
[5] Electricity scenarios for belgium towards 2050 – Elia’s quantified study on the energy transition in 2030 and 2040 (http://www.elia.be), http://www.elia.be/~/media/files/Elia/About-Elia/Studies/20171114_ELIA_… ;(november 2017) [accessed 20 dec 2017].
[6] Referentie van potentieel van daken via zonnekaart: https://www.energiesparen.be/zonnekaart
[7] Report: ’Global trends in renewable energy investment 2017’, UNEP, Bloomberg (2017), https://europa.eu/capacity4dev/unep/documents/global-trends-renewable-e…;
[8] https://www.energyville.be/nieuws-events/groen-licht-voor-bregilab-proj…