Assessing the cable hosting capacity of the EHV grid
A recent study carried out by EnergyVille with contributions from APG and Borealis has shed some light on the cable hosting capacity of the EHV grid. The primary goal of this study was to look at cable integration from a technical and system management perspective and thus to provide insights into areas of improvement using underground cable technology. The intent is to further develop a set of decision making tools to help TSOs prepare for a future with more cables integrated in their networks, and assist the decision making process during system planning.
Authors KU Leuven: Vaishally Bhardwaj, Rickard Lundholm, Simon Nagels, prof. Dirk Van Hertem, Dr. Hakan Ergun, and Dr. Willem Leterme
Contributors APG: Anita Machl and Klemens Reich
Contributors Borealis: Marc Bailleul and Ramona Huuva
According to ENTSO-E’s system statistics of 2018 [1], the total circuit length of AC cables at transmission voltages is 5 567 km, of which 4 558 km are installed at the 220 kV level and 1 009 km at the 380/400 kV level. The ENTSO-E Ten Year Network Development Plan (TYNDP) 2018 highlights that cable technology will play a more significant role in grid development than it has in the past [2], but as specific requirements for transmission lines can vary and the surrounding existing grid has to be involved in the assessment, a case by case analyse will always be necessary.
Still, whereas UGC technology is increasingly used in medium voltage distribution and in high voltage applications up to 150 kV, its deployment at EHV remains limited. Currently, cables represent less than 1 % of ENTSO-E’s 380 kV/400 kV AC grid [1]. In [3], a summary of long length AC HV and extra-high voltage (EHV) cable projects are presented (onshore and offshore). At the EHV level, 45 different cable projects are listed. Out of the 45 different cable projects listed, the average circuit-length of all cable projects is 38 km with an average power of 1.000 MVA per project. The longest installed EHV cable to date is the Malta-Sicily connection with 119 km of cable (95 km submarine, 24 km land) and rated for 220 kV with a capacity of 200 MW [4].
While having the benefit of being hidden out of sight, the electrical behaviour of UGC differs significantly from overhead lines (OHL). Due to the construction of UGC, their capacitance in EHV applications is around 20 times greater than that of OHL, while their inductance is 5 times lower. This significant difference can be overlooked at low degrees of cable penetration but fundamentally changes the operating behaviour of the high voltage grid as the number of cables increases. Additionally, to the grid analysis perspective, planning and operational procedures must be adapted as well when integrating cables as these are historically based on overhead lines as the sole technology used.
The study report aims to answer the following questions
- Which technical hurdles are the most binding for cable integration, and which can be overcome?
- Are the limits to UGC use specific for certain cable sections or for the entire system?
- Is there a maximum cable length, which can be accommodated by the system?
- Are there concentration effects when placing many cables in each other’s proximity?
- Is there a metric to quantify the maximum hosting capacity?
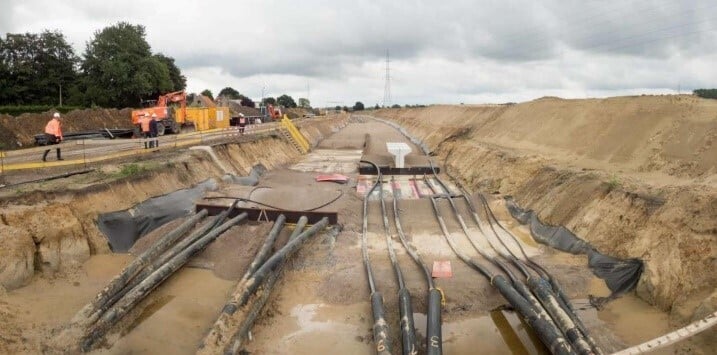
The study focuses on five different phenomena that are affected by the installation of underground cables. Firstly, the reactive power management, as due to the capacitive nature of cables the behaviour of the grid will fundamentally change. The selection of the reactive power management strategies (i.e., compensation) and the corresponding devices will have a significant effect on the number of cables that can be accommodated in the grid. Without compensation devices the addition of cables could lead to severe voltage limit violations and the inability to transmit the desired active power, see Figure 2.
An analysis was performed to show that a distributed compensation strategy leads to the best results from a system management point of view. However, for the practical application, a detailed analysis is required to determine optimal location(s) as well as size and type of reactors. Another effect to consider is that optimal reactive power compensation potentially triggers problems during switching actions (zero-missing-phenomenon).
The addition of cables has a positive effect on voltage stability, increasing the grid’s power transfer capacity, which is by nature dominated by the inductive behaviour of OHL. As such, the capacitive nature of UGC increases the voltage stability margin of the grid. During a switching event e.g., a line fault, however, uncompensated open-ended cables may contribute to a surplus of reactive power that might force generators to supply additional reactive power. This could lead to under-excited generators and voltage dips in the grid. Therefore, detailed studies regarding switching sequences are recommended when integrating cables.
The capacitive nature of UGCs also leads to lower resonance frequencies observed in the high voltage grid. Harmonics commonly emitted by industrial consumers are typically in the following ranges:
- Energization of transformers: 2nd, 3rd, and 4th harmonics
- Harmonics emitted by industry (HVDC converters, arc furnaces, etc.): 5th, 7th, 11th, and 13th
If a resonance condition exists and a voltage/current with the corresponding frequency is emitted, then high overvoltages and overcurrents can strain grid components and lead to accelerated ageing with a high possibility of damaging or destroying components. This is a critical phenomenon and has been a cause for concern for many TSOs (Transmission System Operators), e.g., EirGrid, Energinet, and Elia. Resonance peaks are known to limit the cable length in various projects. The research shows that procedures exist and are used by TSOs to evaluate the severity for resonances. However, no standard exists to date. Passive filters are the most common method to lower resonance peaks in the system and allow for longer cable lengths. However, with the application of filters, the overall complexity of the system further increases.
UGC and OHL have different thermal capacities, which can make the temporary overload management of mixed OHL/UGC more complicated. The high overload capability of UGC allows implementing mixed UGC/OHL systems with a lower continuous rating for the UGC sections, since the mixed system will be fully loaded in N-1 only and the UGC sections can be overloaded long enough in emergency situations to wait for corrective actions of the system operator. This results in decisions in the planning phase that require extra attention. Table 1 shows an overview of some of the different management strategies used for different mixed OHL/UGC configurations.
Table 1. Overview of different management procedures for mixed OHL/UGC
| Voltage (kV) |
OHL rating (A) |
UGC rating (A) |
Emergency Rating (OHL) | Emergency Rating (UGC) | |
| Australia [5] | 275 | 846 | 680 | 920A / 2 hrs | 1200A/ 2 hrs |
| Netherlands [3] | 380 | 4000 (2.5k) | 2500 | Operated at N-1 | 4000A / 1 week |
| Denmark [6] | 400 | 1600 | 700 | Operated at N-1 | 1400A / 30 hrs |
| Belgium [6] | 150 | 1161 | 1100 | 1900A / 1 week | 1900A /1 week |
With respect to switching phenomena, there are two main aspects, namely (de)energisation of cables and the zero-missing phenomenon. When energising underground cables there is a risk for high transient overvoltages and inrush currents. In a mixed OHL/UGC configurations the addition of cables will lower the maximum peak of the transient overvoltages. When de-energising the cable TSO’s should be aware of trapped charges, which can lead to significantly high overvoltages (up to 3pu recorded), and to avoid re-closure procedures unless proper equipment is utilized to detect a fault in the underground cable segment. Zero-missing phenomenon occurs when two conditions are met:
- A shunt reactor connected to the cable is energized at the same time as the cable
- The shunt reactor is compensating more than 50% of the reactive power of the cable
This results in a DC current component that forces the current to not pass zero. In turn, this leads to malfunction of devices that rely on the current crossing zero and prevents the opening of circuit breakers to clear the fault. The findings indicate that the severity of overvoltages and inrush currents that correspond to both phenomena can be mitigated if extra consideration is given to the configuration of the UGC/OHL connection and the compensation type that is used. Therefore, it is expected that this phenomenon will not have a system-wide effect on the cable hosting capacity (CHC), nor will it directly limit the amount of cable in a grid. However, this phenomenon must be studied individually for potential cable locations to determine the best solution.
The study shows that the interaction of phenomena cannot be neglected. The phenomena must be studied and looked at individually as well as in a combined fashion. Especially, mitigation measures for one particular phenomenon might trigger unwanted effects for another phenomena. The combination of these findings has led to the preliminary definitions of a CHC from a systems perspective, i.e., the maximum number of cables that a grid can accommodate. This study report identifies six Key Performance Indicators (KPIs) each with their own threshold limits, which if exceeded leads to an increase in the level of complexity:
- The change in voltage across all buses in the system. The limit is defined by the TSO (typically, ±10% of the nominal voltage, e.g. 342 – 418 kV for 380 kV) and the severity is defined by the number of buses that violate the limit and how difficult it is to manage the system. The difficulty of system management is defined by the number of buses violating the TSO voltage limits. Voltage limit violations on one particular bus are considered as a minor violation as the voltage as this can be solved with local measures. With increasing number of buses violating or approaching the voltage limits more complicated and system wide reactive power management is required.
- Reactive power flow in N-0 situations (or during steady-state). The KPI is defined as the ratio of reactive power flow through the cable and its MVA rating. The maximum threshold for the reactive power is defined as 30% of the MVA rating of the cable.
- Maximum and average line loading for N-1 contingencies. The threshold is defined as exceeding 100% of the overhead line rating of an OHL/UGC system. This KPI does not consider the duration of loading and assumes that by exceeding the threshold in the N-1 state, the system is more complex to manage.
- Observation of a high self-impedance at any substation in the range of the 2nd, 3rd, and 4th harmonic. The thresholds that have been used by different TSO’s varies, and the ones used in this study report are defined by Energinet: 400Ω, 600Ω, 2400Ω for the 2nd, 3rd, and 4th harmonic respectively.
- A high harmonic background amplification at any substation for the 5th, 7th, 11th, and 13th harmonic. This KPI is defined by the second voltage summation law and a ratio of the voltage before and after the addition of a cable. The ratio is chosen to be 2 pu and is also based on a method derived by Energinet.
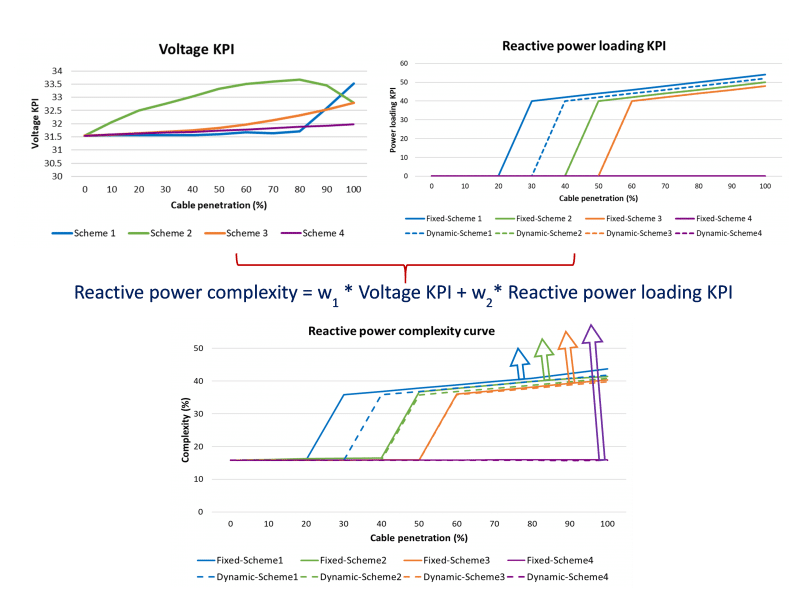
Each individual KPI is combined to a single complexity value using a weighted sum approach,

where, w is the weight assigned to the specific KPI, and n is the maximum number of KPI’s that have been defined, e.g., five for the study at hand. A methodology to derive these KPIs is presented and the CHC calculations are applied to an academic test system and a representative EHV grid that is derived from the Austrian EHV transmission grid. The results from the EHV grid are briefly shown in Figure 3 and Figure 4 where four different possible cable locations were chosen. The total circuit length of the four cables amount to 678 km.
The findings show that the primary hurdle when integrating cables, the need for high reactive power compensation for longer cable route lengths. There is an initial complexity due to voltage violations, however the impact of cables is not significant in the analysed cases. Depending on the choice of the compensation strategy it can be observed that the reactive power flow violates the defined limits even in non-distributed situations (N-0) at high cable penetration levels.
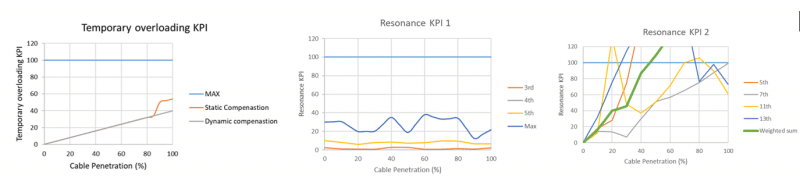
The second hurdle that limits the total cable route length is the resonance condition. The second resonance KPI (the emission of 5th, 7th, 11th, and 13th harmonic) exceeds the threshold at 45%, which corresponds to a total circuit length of 271 km. The effect of harmonic filters has not been considered in this report, but it is expected that the installation of such filters would allow a higher CHC. The study has not identified a universal maximum cable length limit, as each grid has its own respective layout and components that affect the installation of cables. The CHC metric can be a good comprehensive approach to study particular networks and to identify the system’s cable limit, but a case-by-case analysis is required to fully understand the effect of each cable integrated in the system.
The KPI approach, as introduced in this study, opens the path to a standardized and unified evaluation of the CHC in any given transmission system. The study does not consider economic aspects, nor does it consider such aspects as reliability or life-cycle assessment. These would need to be considered in a comprehensive review. The primary goal of this study is to look at cable integration from a purely technical and system management perspective and thus to provide insights into areas of improvement using underground cable technology. The intent is to further develop a set of decision making tools to help TSOs to prepare for a future with more cables integrated in their networks, and assist the decision making process during system planning.
Bibliography
[1] ENTSO-E, “Statistical Factsheet 2018,” Brussels, 2018.
[2] ENTSO-E, “2025, 2030, 2040 Network Development Plan 2018 Connecting Europe: Electricity,” ENTSO-E, Brussels, 2018.
[3] Cigre, “Implementation of long AC HV and EHV cable systems,” Cigre Working Group B1.47, vol. 680, p. 190, 2017.
[4] L. Colla, M. Gabrieli, A. Iliceto, M. Rebolini, S. Lauria, P. Grima, J. Vassallo, B. Zecca and B. Venturini, “HVAC submarine cable links between Italy and Malta. Feasibility of the project and system electrical design studies,” Cigre, Vols. B1-104, 2010.
[5] L. S and S. G, “Hybrid high capacity transmission circuits – challenges for XLPE cables in series with EHV overhead lines,” Jicable, June 2011.
[6] Cigre, “Statistics of AC underground cables in power networks,” Working Group B1.07, Dec 2007.